Welcome to my blog for GOV 1347. Throughout the semester I will be updating this blog and examining various techniques to forecast the 2024 election. For the first week the focus is electoral competitiveness. This blog will analyze the competitiveness of presidential elections and analyze which state vote Democrat or Republican consistently
Electoral Competitveness
To examine whether elections in the US are competitive I utililzed a dataset of the presidential popular vote since 1948. Using this data, I plotted the popular vote for the Democrats and Republicans over time. If elections were competitive, you would expect to see lines that are close to one another and a back-and-forth trend in the winner of the popular vote.
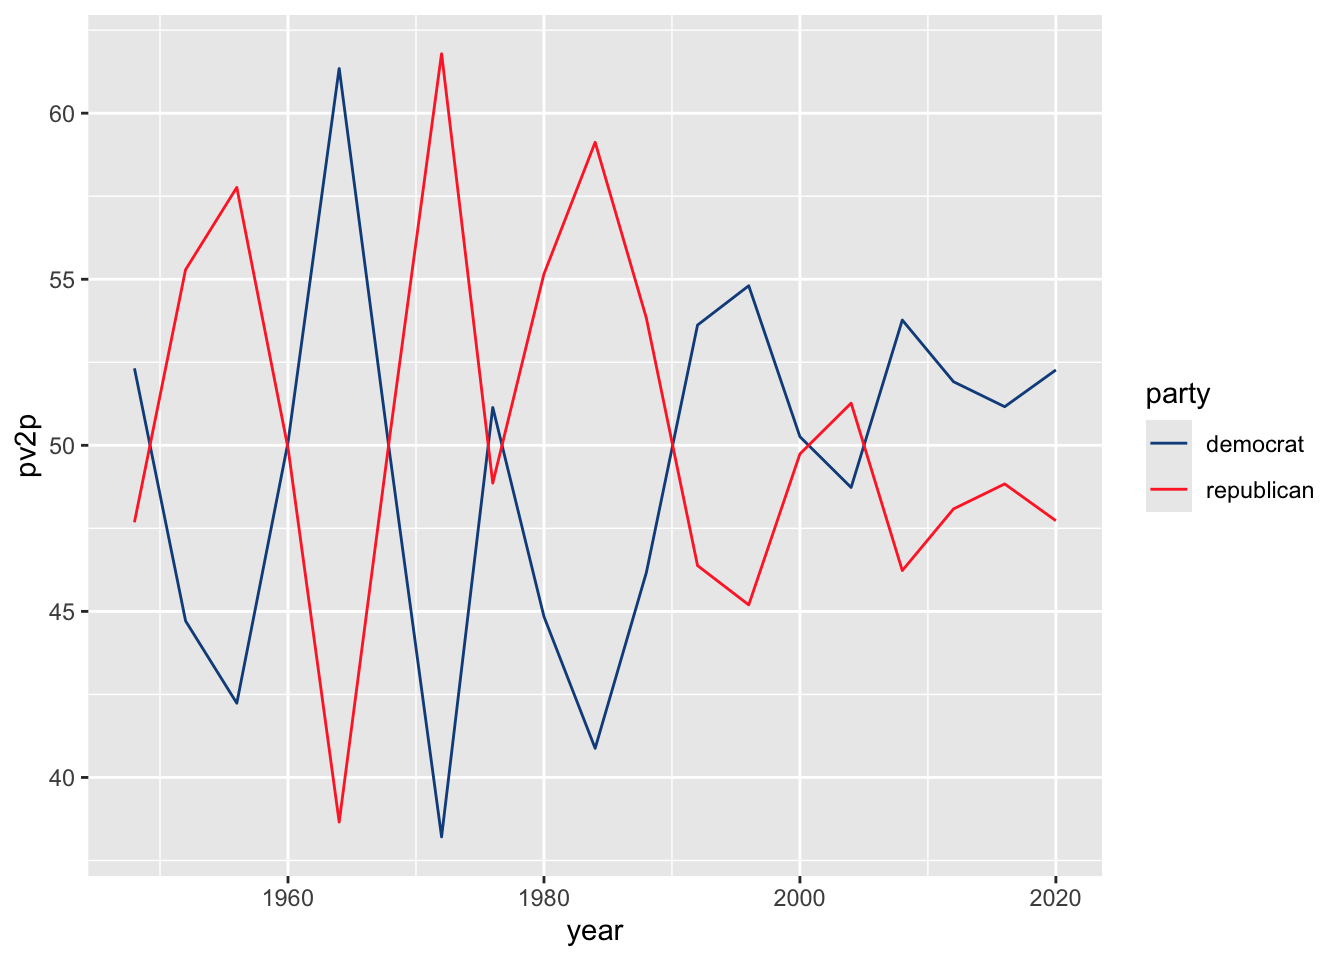
Looking at the above line chart, it seems that elections have become more competitive in recent years. Although elections have swung between parties, the swing has often resulted in large victories. As the chart gets closer to the present the gap between the two parties has dwindled. However, it is important to note that elections in the US are not decided by popular vote but instead are decided by the electoral college. This means that this chart does not tell the full story of electoral competitiveness because there have been a few instances where the candidate who won the most votes did not win the electoral college
Electoral College
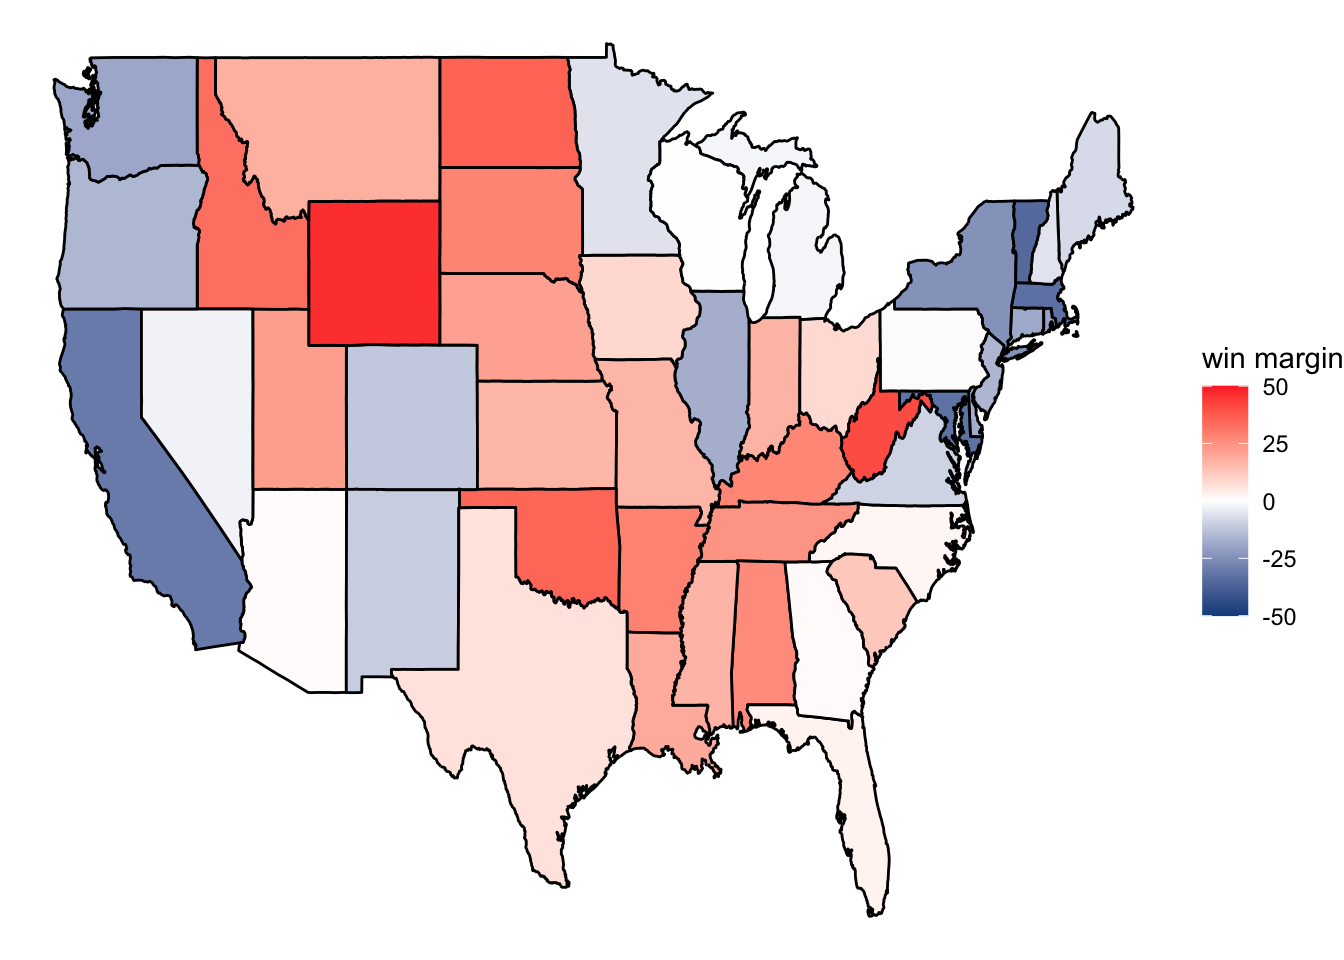
The electoral college is a system of electing the US president based on electors. The electors equal the number of senators + the number of representatives in the house. In the 2020 election, Biden captured 56.8%_ of the electors in the electoral college (306), but only captured 51.3% of the popular vote
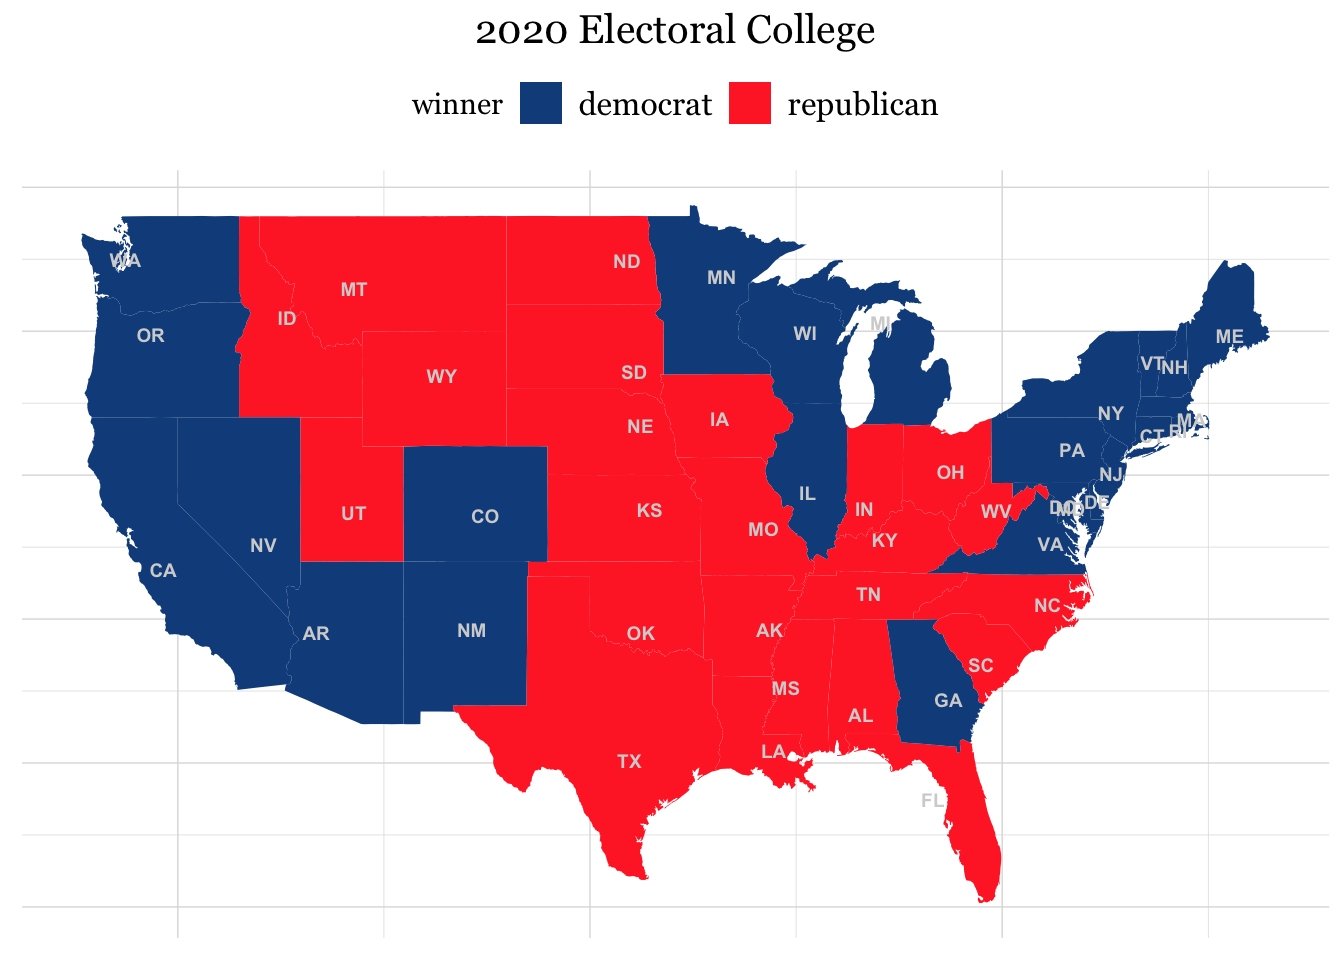
The map above shows the outcome of the electoral college in the 2020 election. Another way to think about electoral competitiveness is at the state level. How many swing states exist?
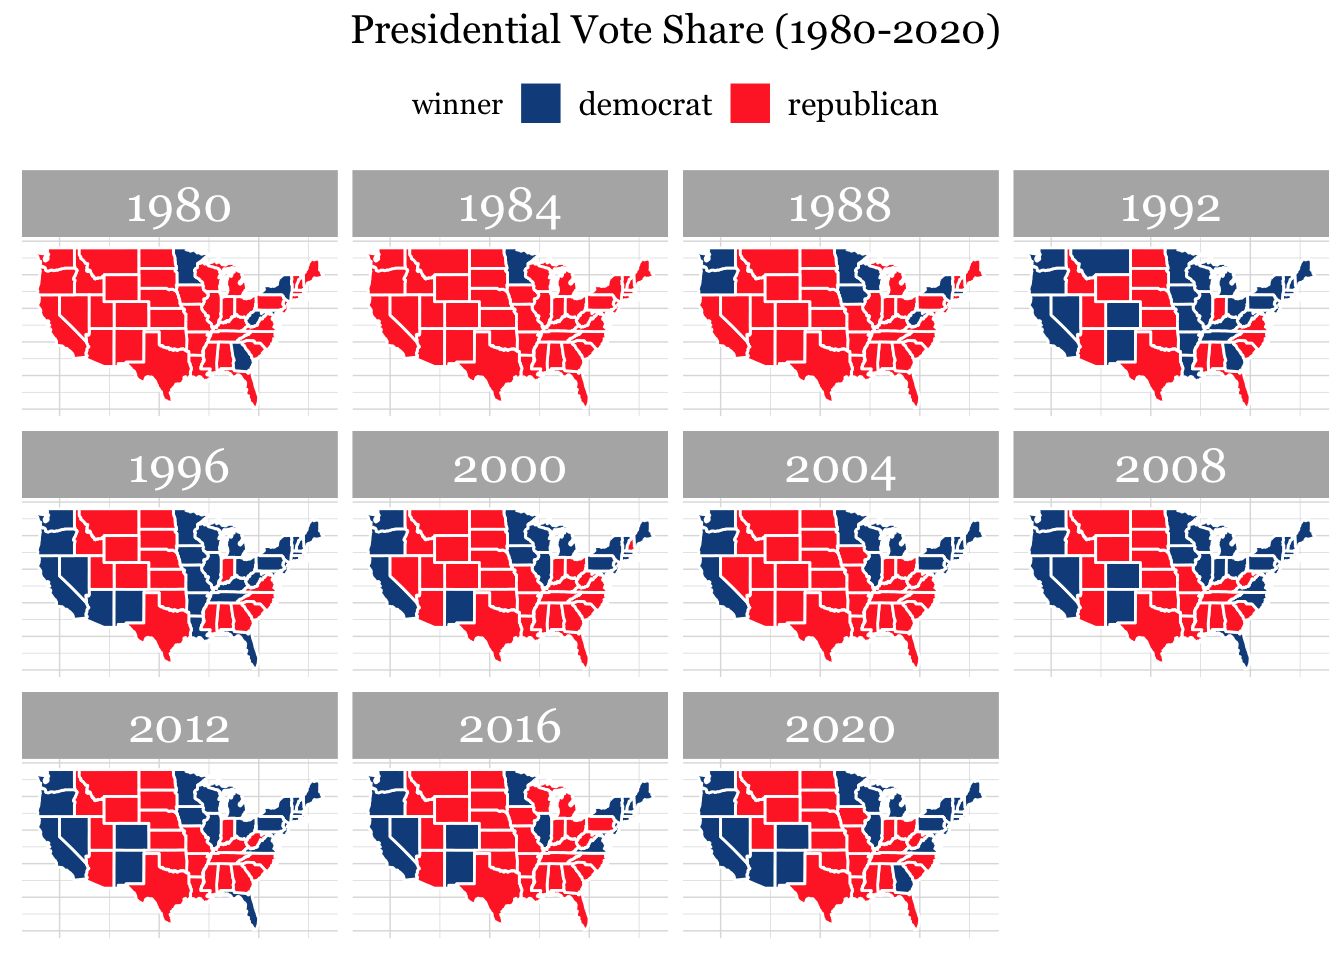
In the map above, it appears that electoral competitiveness has decreased because there are more “safe states”. In the elections from 1980 to 2000 most states voted for each party. However, since 2012 very few states have flipped. This conclusion is in line with the rise of partisan polarization and entrenchment in the US.
Predicting the 2024 Election
For this week’s prediction, I am using a simple model based on the 2016 and 2020 electoral college results. I assigned a larger weight to the 2020 model due to the assumption that closer results are more reflective of contemporary voter intention. The model predicted that Kamala Harris will capture 276 electoral college votes and Donald Trump will win 262. Below I plotted the model’s results for each state. The lighter the color, the closer the model expects the race to be. Notably, Georgia, Wisconsin, and Arizona are expected to be battleground states.